views
Bengaluru is the world’s second-slowest city to drive in after London, with commuters spending an average 29 minutes and 10 seconds to travel 10 kilometres, according to the Traffic Index 2022 released by TomTom.
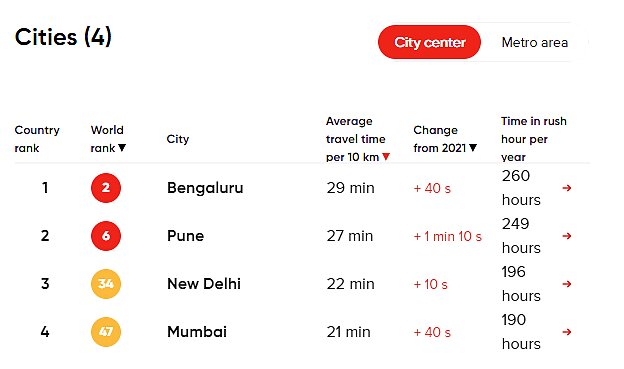
The report by the leading in-vehicle navigation company, covering 389 cities across 56 countries on six continents, ranked UK’s London as the world’s slowest city, with drivers taking over 36 minutes to travel a typical 10 km journey, followed by Bengaluru. Four Indian cities found their place on the Traffic Index, including Bengaluru, Pune, New Delhi and Mumbai. Pune ranked sixth in the world, followed by New Delhi taking the 34th slot and Mumbai ranking at 47th on the list.
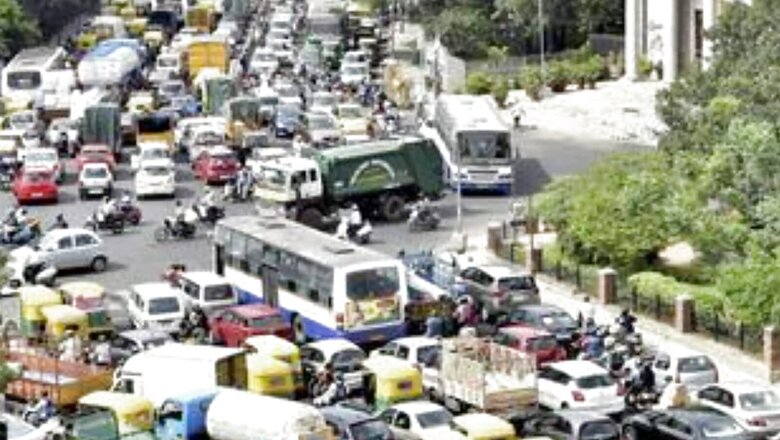
Traffic in Bengaluru
The report noted that Fridays 6-7 pm was the worst rush hour in Bengaluru, with drivers taking an average of 37 minutes and 20 seconds to travel 10 km.
For Bengaluru, travel times and speeds are based on trip data spanning 543 billion (109) km anonymously collected during the year from drivers within the larger metropolitan area (“metro”) or a 5 km radius from the center (“city center”) throughout the complete road network — including fast roads and highways crossing this area, TomTom stated in its report.
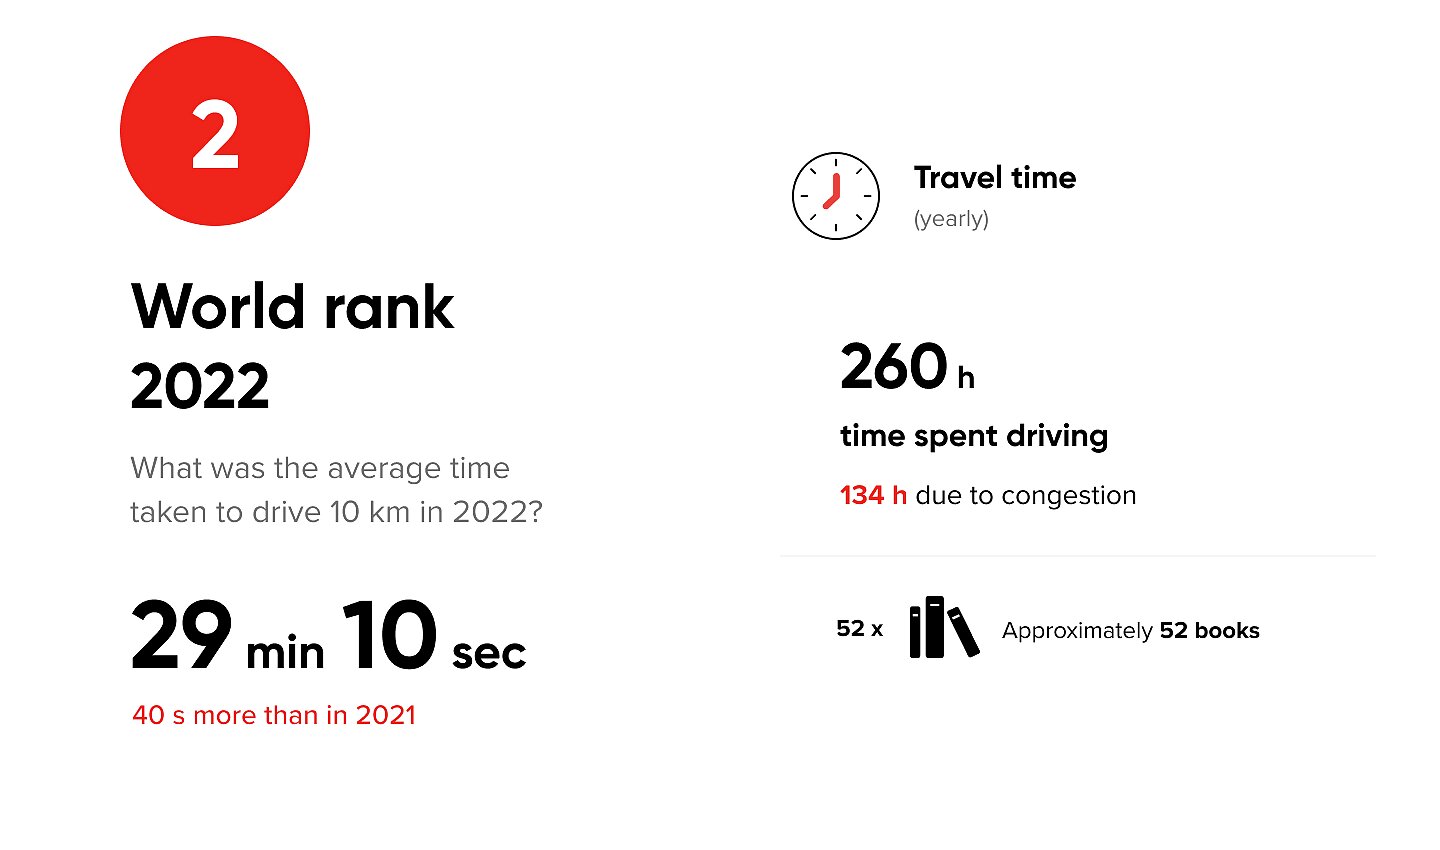
In India’s IT hub, known for its traffic woes, drivers have spent 260 hours driving and lose 134 hours a year to traffic based on typical driving behaviour. The time spent is four hours 55 minutes more than it was reported in 2021.
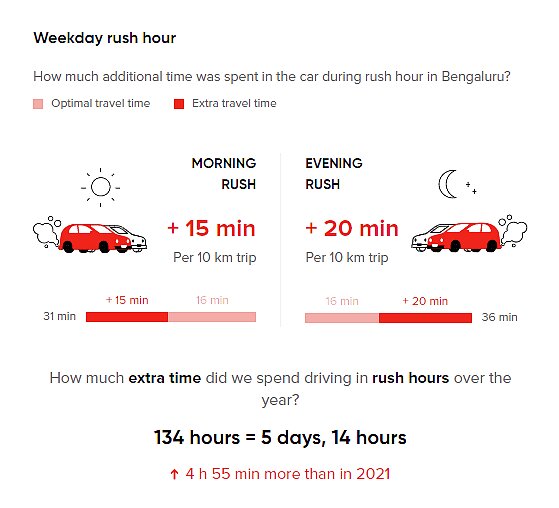
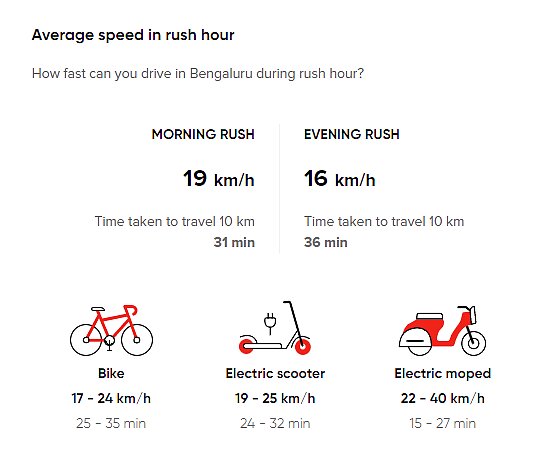
How fast can you drive in Bengaluru during rush hour?
It also said during the morning rush hour, the time taken to travel 10 km was 31 minutes at a speed of 19 km per hour. Average speed in rush hour. During evening peak traffic hour, time taken to travel 10 km was 36 min at a speed of 16 km per hour.
The Karnataka capital is fifth in the table of “Cities with the highest CO2 emissions per driven miles at rush hour”. Average annual CO2 emission based on a six-mile round trip in Bengaluru is 974 kgs for petrol cars. London, Paris, Manila and Bucharest are above Bengaluru in that order.
World Traffic Rankings
Bengaluru is followed by Dublin in Ireland and Saporro in Japan raking third and fourth in the list respectively.
“London is the world’s slowest city — taking over 36 minutes to drive a typical 10 km journey. However, London is already a slow city to begin with. In optimal traffic, that same 10 km trip would take just over 24 minutes,” it stated.
The report further noted that Bengaluru and Bogotá in Colombia, which ranked 10th in the Traffic Index, suffer from traffic like London even though they are quicker to get around in optimal conditions. “The optimal travel time for a 10 km trip is around 16 and a half minutes in the Indian city, with traffic, it’s 25 minutes and 40 seconds. In the Colombian capital, optimal travel times are around 14 minutes 38 seconds, however, add traffic and that goes up to 26 minutes 20 seconds. Both lose out to traffic by a similar margin,” it stated.
The Traffic Index measures cities around the world by their travel time, fuel costs and CO2 emissions and provides access to city-by-city information to aid policymakers, drivers, automakers and city planners to help tackle traffic-related challenges, according to the official website.
The 2022 report stated that the overall traffic levels were still lower than before the pandemic in 2019, but compared to 2020, traffic increased and spread out throughout the day.
Explaining the methodology, the company took a robust sample of GPS traces from more than 380 cities worldwide and cut all the journeys into sections. Travel times for each of these segments were calculated. “TomTom then used these insights to simulate a typical driver who undertakes a 10 km commute each day, for a year. Doing so makes the complex data easier to understand and creates a consistent platform to compare city to city,” it stated.
Read all the Latest India News here





Comments
0 comment