
Using Windows
Open your project in Excel. You can either open Excel from your Start menu then click File > Open or you can right-click the project file in your file manager and click Open with > Excel.
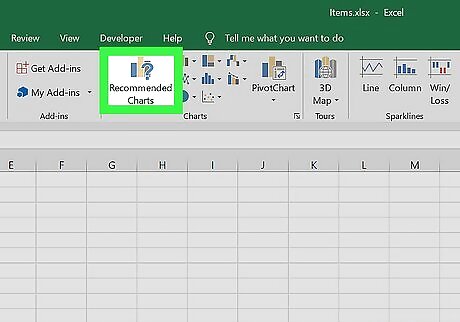
Click to select a chart. You can only add trend lines to a chart, so if you don't have one create one. To create a chart, select your data set and click Insert > Recommended Charts or click a chart that you want. In order to add two trend lines, you'll need to have data for more than one thing, like the performance of two or more sales people instead of a single store.
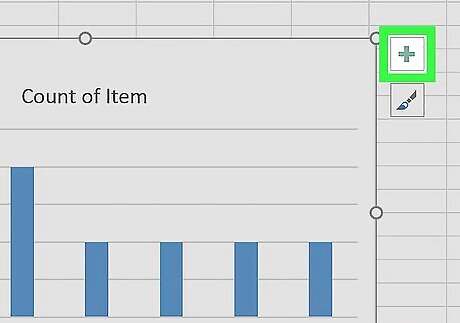
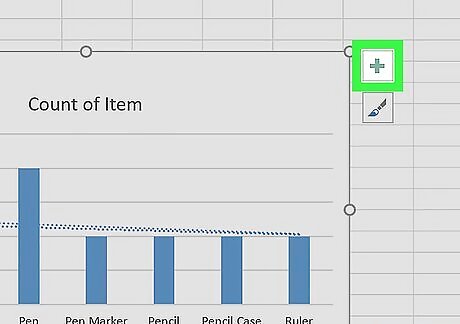
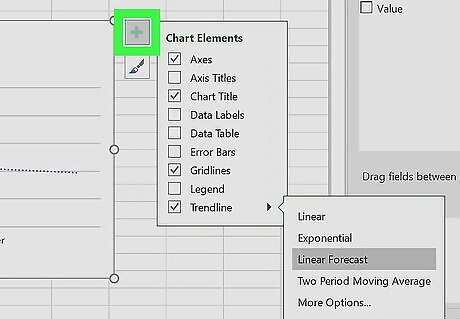
Click +. It's at the top right corner of the chart and will open a drop-down menu.
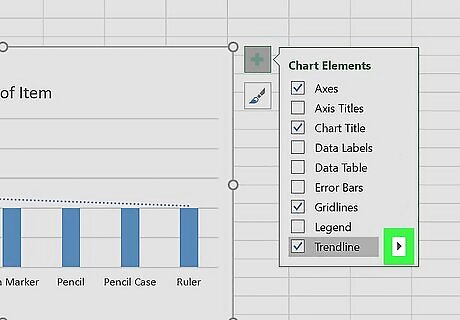
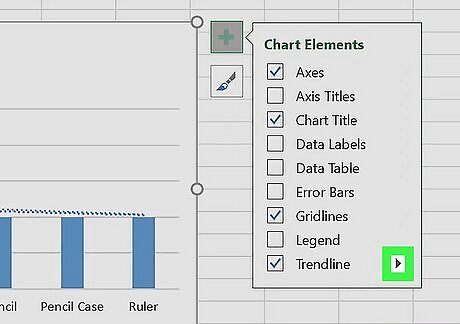
Click Add Trendline. It's near the bottom of the menu.
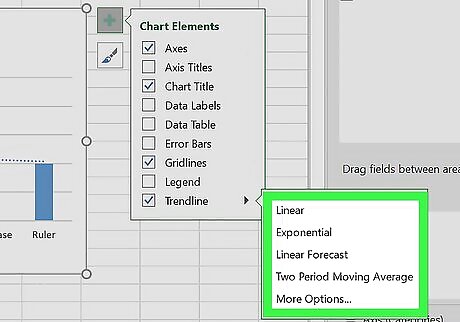
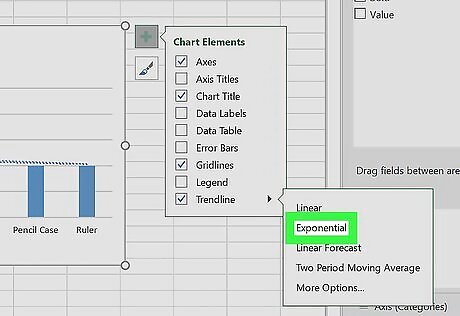
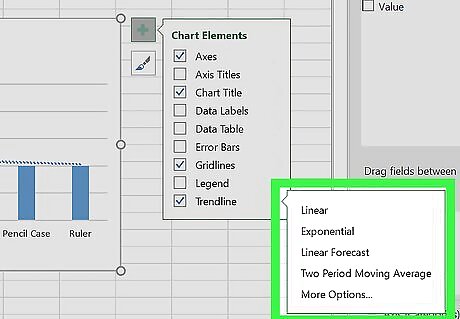
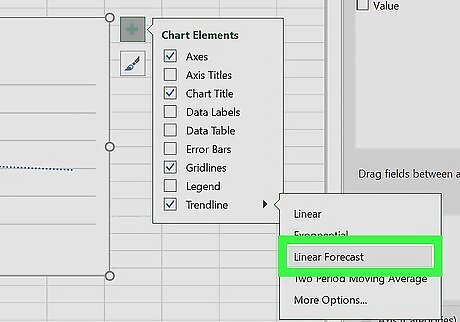
Click a type of trendline that you want. The type of line, like Exponential, will change how the data is perceived, so you can click these to see a preview of the final result.
Select the data to apply this trendline to. If you're using the previous example of store employees instead of a single store, you can apply the exponential trendline to Jeff's data to show a severe increase in sales.
Click Ok. The trendline you picked and set will appear on your chart.
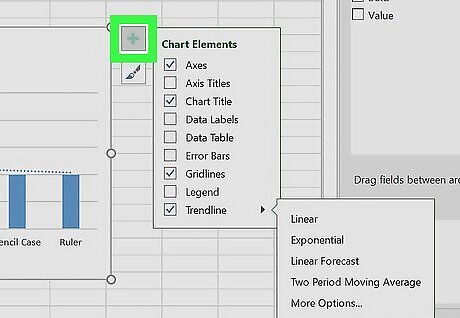
Click +. You'll only see this when the chart is selected, so if creating a trendline de-selected the chart, you need to click it again. It's at the top right corner of the chart and will open a drop-down menu.
Click Add Trendline. It's near the bottom of the menu.
Click a type of trendline that you want. The type of line, like Exponential, will change how the data is perceived, so you can click these to see a preview of the final result.
Select the data to apply this trendline to. If you're using the previous example of store employees instead of a single store, you can apply the linear projection trendline to John to show that his sales have been steadily decreasing.
Click Ok. The trendline you picked and set will appear on your chart and you'll have two trend lines visible.
Using Mac
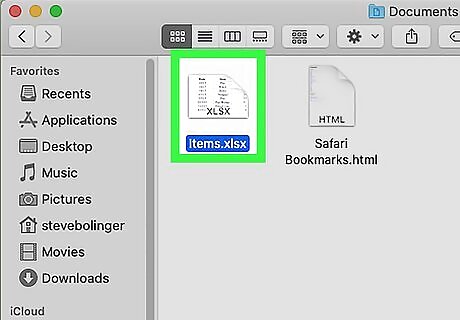
Open your project in Excel. You can either open Excel from your Applications folder then click File > Open or you can right-click the project file in Finder and click Open with > Excel.
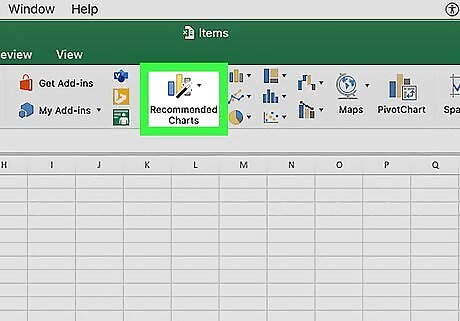
Click to select a chart. You can only add trend lines to a chart, so if you don't have one create one. To create a chart, select your data set and click Insert > Recommended Charts or click a chart that you want. In order to add two trend lines, you'll need to have data for more than one thing, like the performance of two or more sales people instead of a single store.
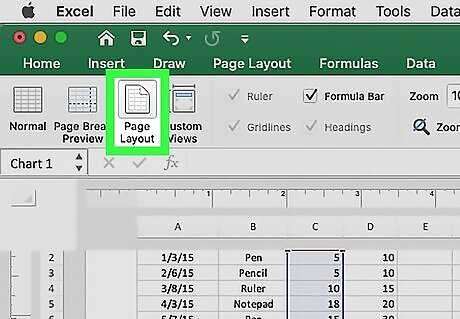
Change the view to "Print Layout." You can do this by going to View > Print Layout.
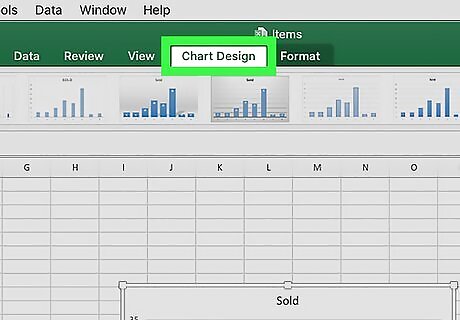
Click Chart Design. It's at the top right corner of the chart and will open a drop-down menu. If you don't see this tab next to Review and View, make sure you have the chart selected.
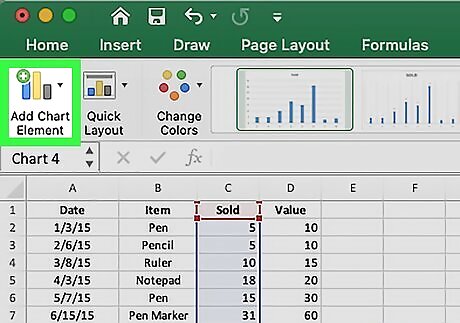
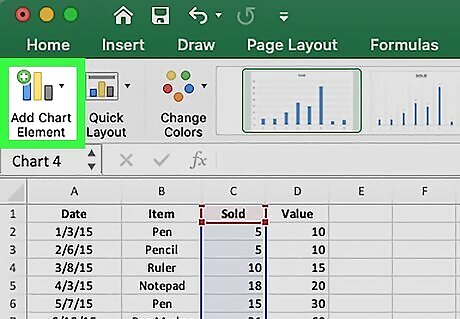
Click Add Chart Element. You'll see this as the first option to the left of the "Chart Design" menu.
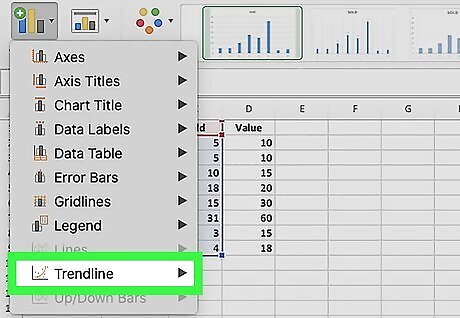
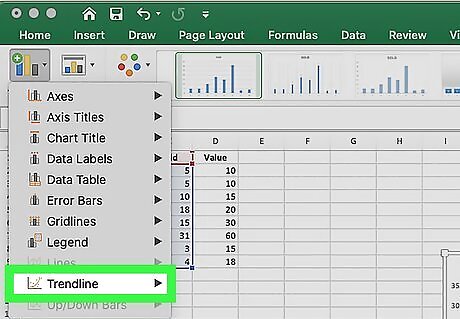
Click Trendline. It's near the bottom of the menu.
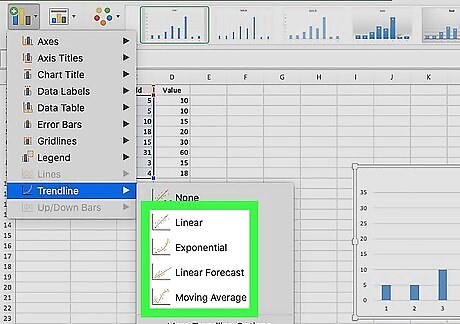
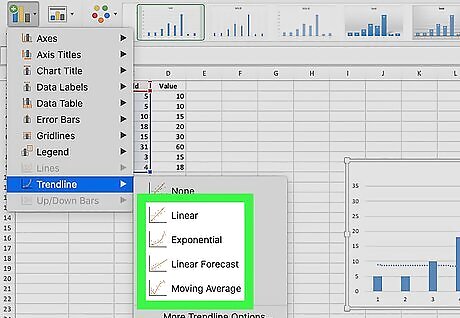
Click a type of trendline that you want. The type of line, like Exponential vs Moving Average, will change how the data is perceived, so you can click these to see a preview of the final result. Once you make a selection, the trend line will appear in your chart.

Click Chart Design. It's at the top right corner of the chart and will open a drop-down menu. If you don't see this tab next to Review and View, make sure you have the chart selected.
Click Add Chart Element. You'll see this as the first option to the left of the "Chart Design" menu.
Click Trendline. It's near the bottom of the menu.
Click a type of trendline that you want. The type of line, like Exponential vs Moving Average, will change how the data is perceived, so you can click these to see a preview of the final result.


Comments
0 comment