views
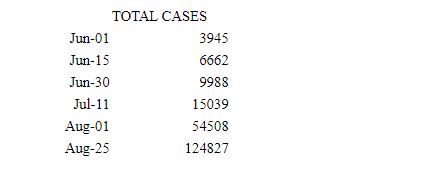
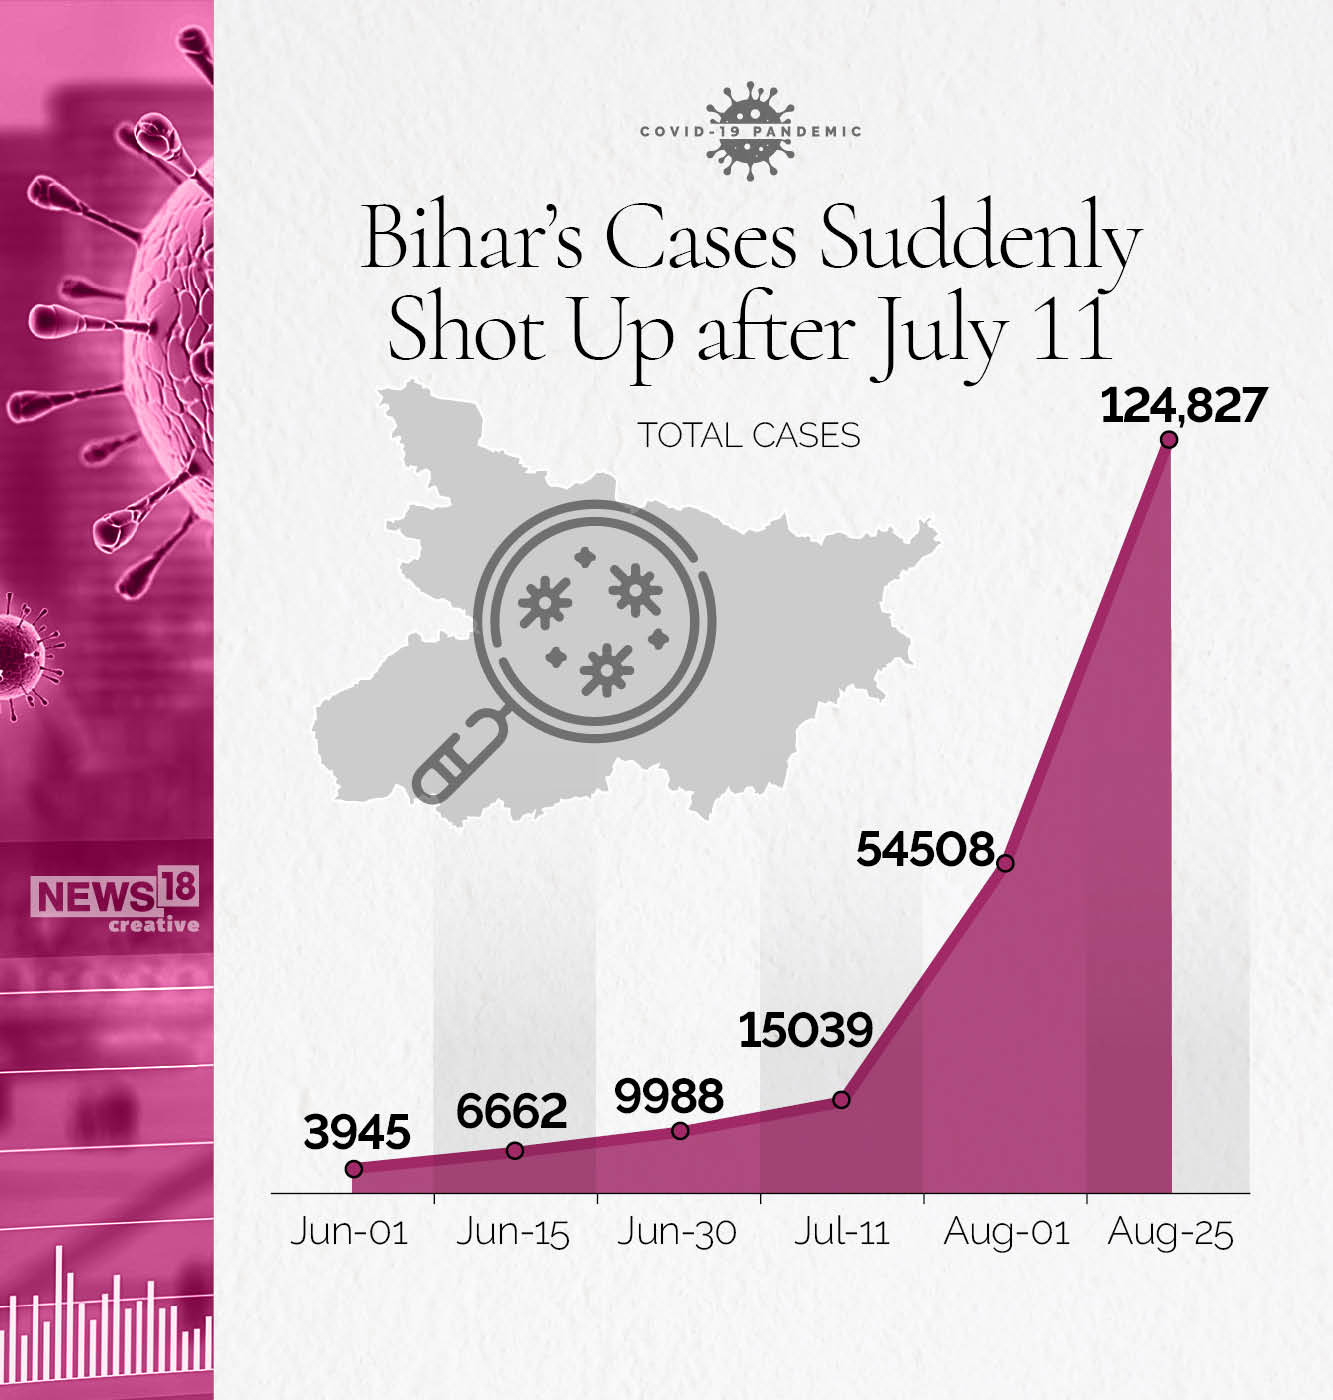
Bihar had a total of just 15,039 Covid-19 cases till July 11. Till then, the state had not reported a single day when the daily count had crossed three digits.
On July 12, 1,266 cases were reported and the state has since then seen a sharp surge in the number of infections.
As on August 25, 1,09,788 cases, which is almost 88% of Bihar’s total case-load (1,24,827), have been reported in the last 45 days. The state has averaged 2,440 cases daily in this one-and-a-half-months period.
The nine-day cumulative cases suddenly shot up from 4,357 on July 11 to 12,416 on the 20th. It further rose to 18,464 on the 29th and 25,875 on August 7. However, it dropped to 20,734 on the August 25 after reaching a high of 32,299 on August 16.
Creative 1 (Bihar – Rise in Cases)
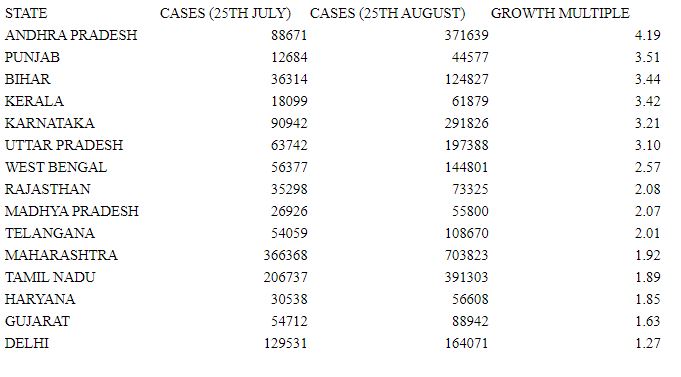
Bihar’s case-load has risen by almost three and a half times from the July 25– its increment has been the third-highest amongst 15 major states of India during this period.
From Number 10 in case-load, it has come up to Number 8 over the last month.
However, being the third-most populous state of India with around 12 crore people, Bihar’s case-per-million of 1,044, places it among the better-performing states of the country. Only Madhya Pradesh (678), Uttar Pradesh (877) and Rajasthan (949) have reported a lower incidence per million amongst the major states.
Creative 2 (Growth over last month)
LOW POSITIVITY RATE AND MORTALITY RATE
Bihar had conducted 25.7 lakh tests by August 25 – the fifth-highest in the country after Uttar Pradesh, Tamil Nadu, Maharashtra and Andhra Pradesh.
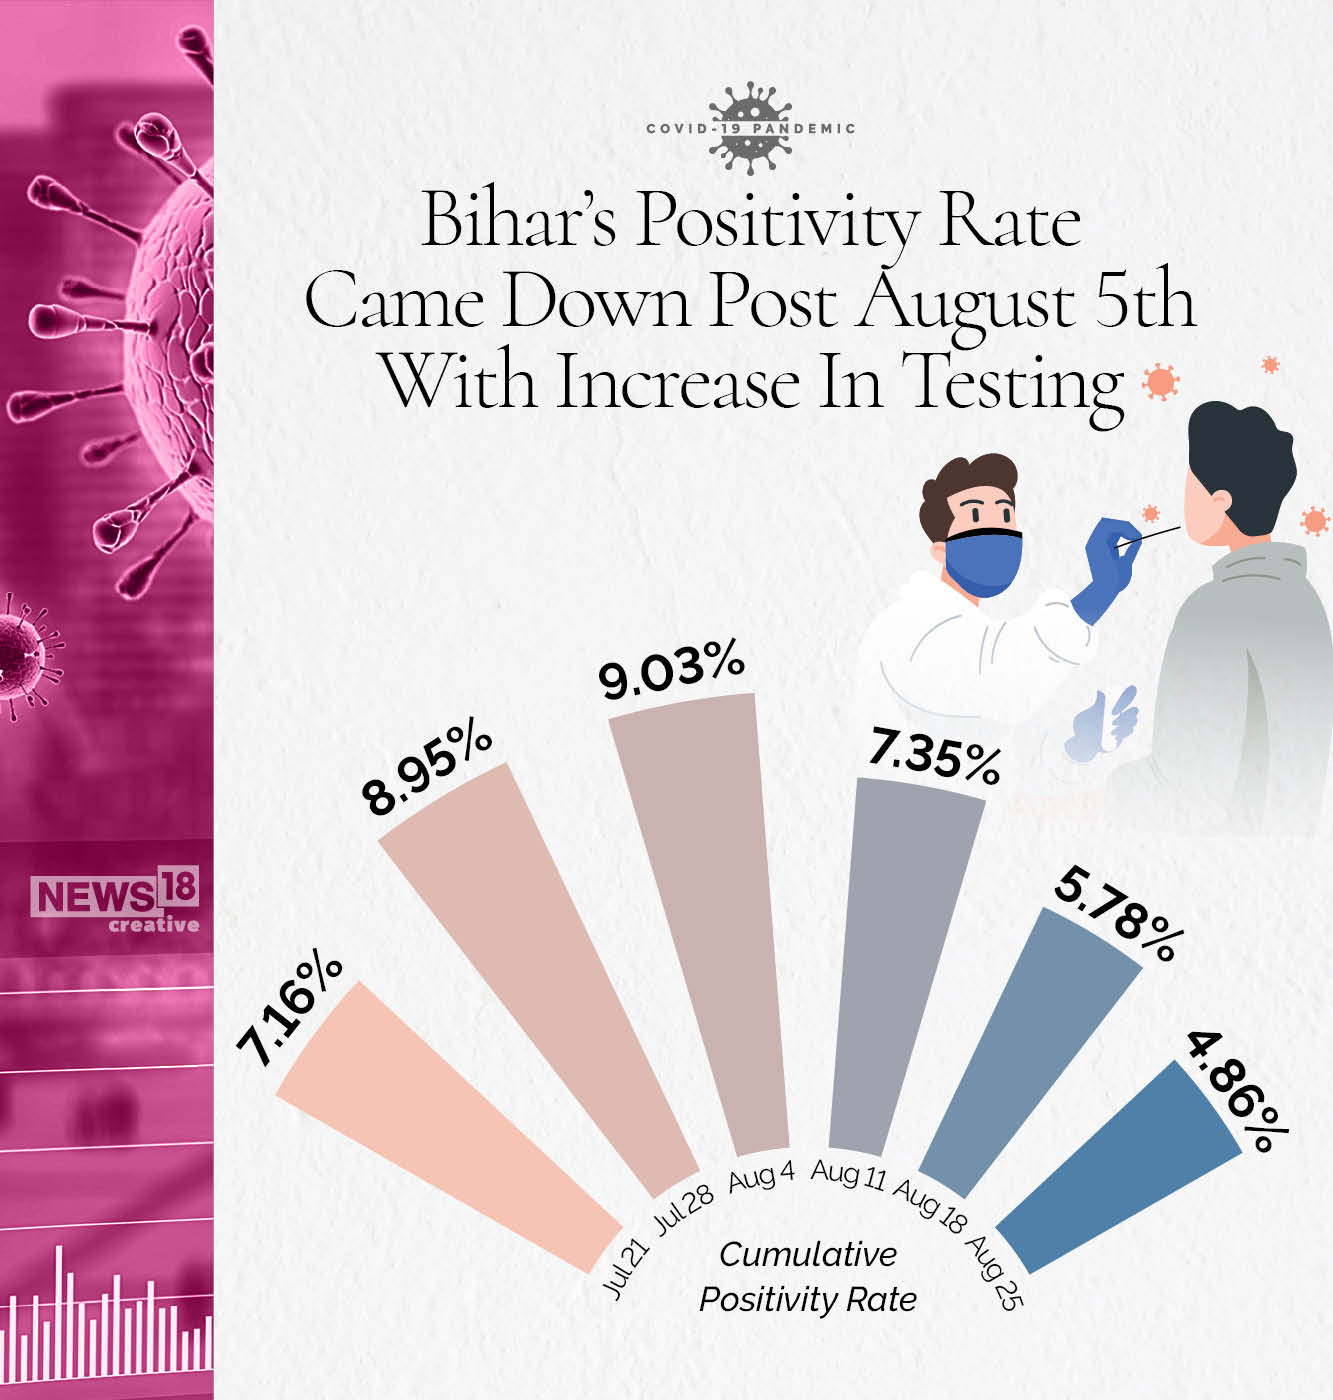
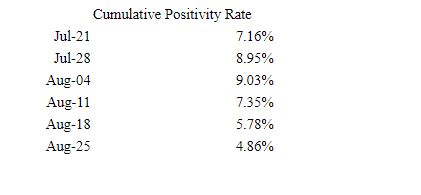
With surge in cases in July, its positivity rate rose from 7.16% on July 21 to 9.03% on August 4.
Testing was ramped up post on August 5, which lead to a fall in positivity rate to 7.35% on August 11. It has since come down to 4.86% on August 25, which is much less than the national average of 8.6%. Among major states, only Rajasthan (3.4%), Uttar Pradesh (4.1%), Kerala (4.2%), Madhya Pradesh (4.5%) and Gujarat and Punjab (4.7%) have a lower Positivity Rate.
Creative 3 (Positivity Rate)
Bihar’s daily positivity rate has been less than 2% on August 24-25, while the average for the last 10 days stands at 2.39%.
Another parameter that indicates that Bihar has effectively managed to control the spread of the virus is its R-Value, which basically reveals the number of new cases that are expected to emerge from a single case.
An R value of less than one suggests that the rate of infection is slow.
Bihar’s R-Value has gone down from 1.22 on August 12 to 1.16 on August 19 to 0.94 on August 24.
But the state’s greatest achievement during the pandemic, given its population and economic challenges, has been its ability to control the number of Covid-19 fatalities.
With just 644 deaths, the state has the third-lowest toll among major states after Kerala (245) and Haryana (623). In terms of deaths per million population, Bihar has recorded just five – the lowest in the country.
Overall, its mortality rate of just 0.52% is the second-lowest in India only after Kerala (0.4%).
However, almost 82% (526 of 644) of the total number of Covid-19 fatalities in Bihar have corresponded with the rise in the number of cases in the last 45 days.
PATNA HOTSPOT WITH EXPONENTIAL RISE IN CASES
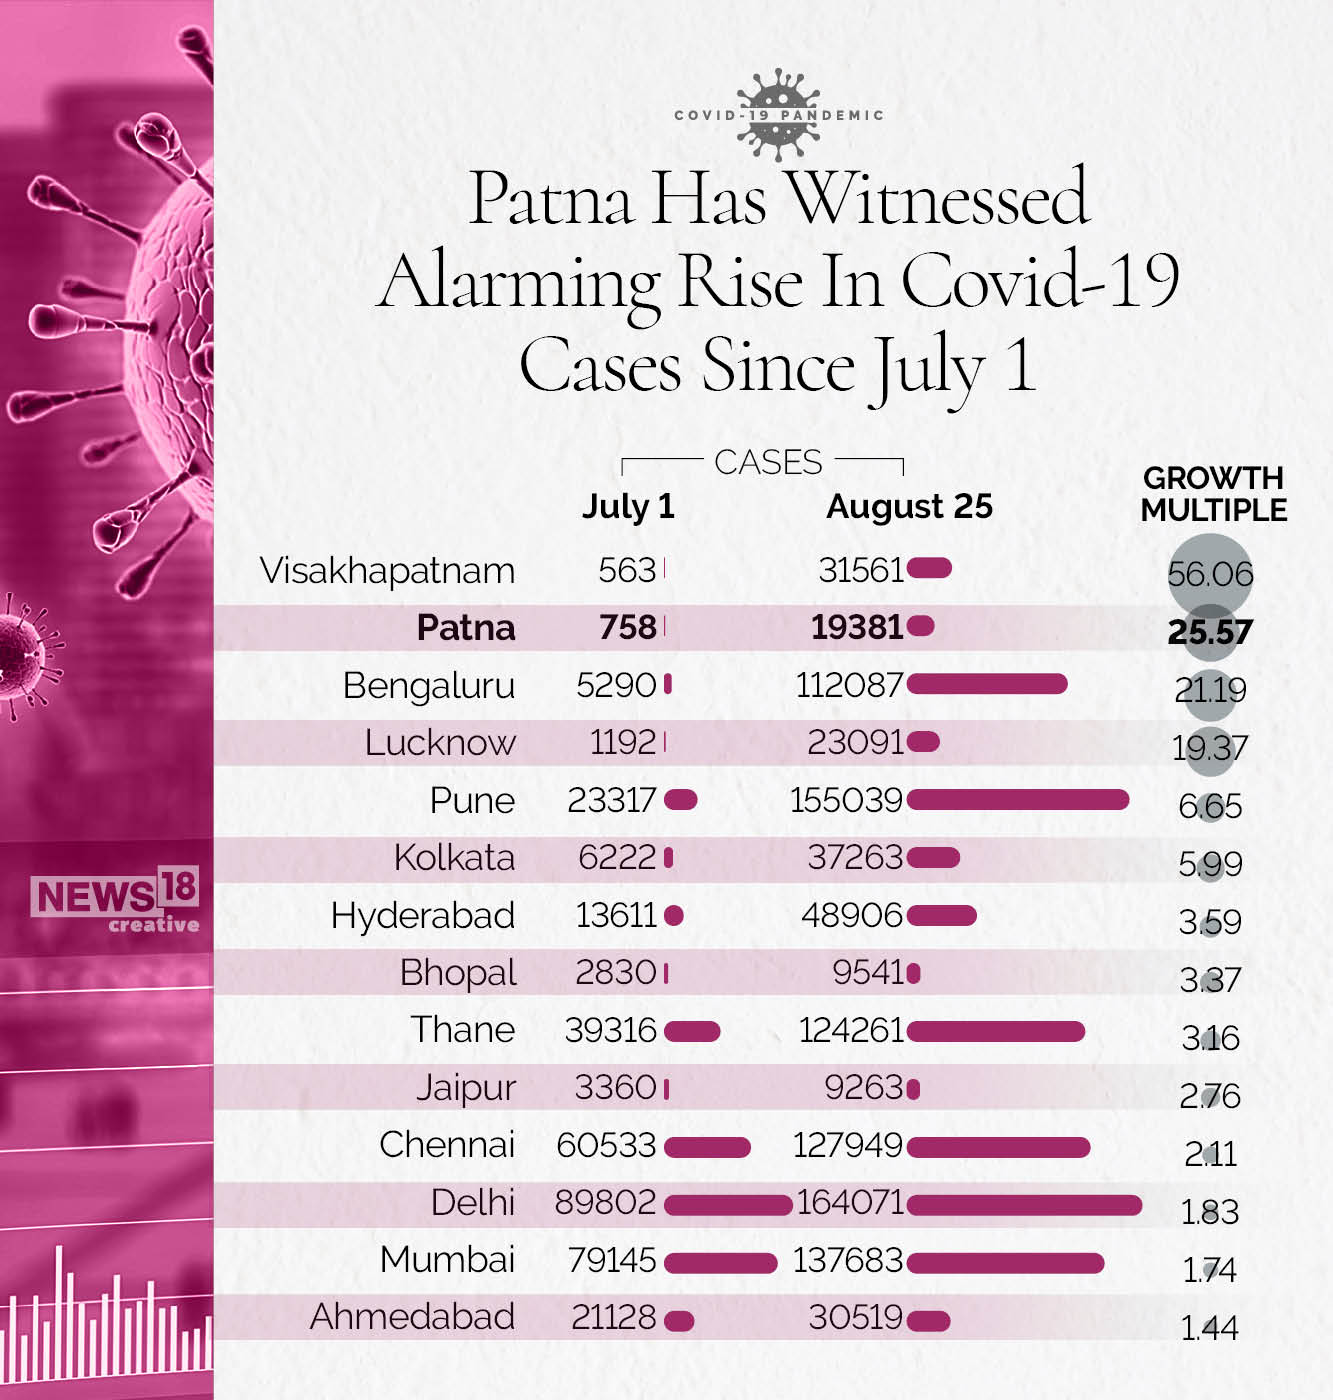
The state capital, Patna, is the most severely affected district in Bihar with 19,381 cases as on August 25. It accounts for 15.53% of the total case-load of the state.
Creative 4 (Patna – exponential rise in cases)
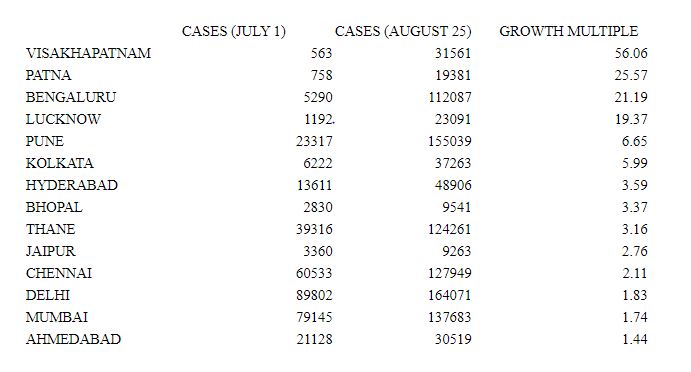
Patna has seen a dramatic increase in the number of cases since July 1. The case-load has increased by more than 25 times in this time-frame.
Muzaffarpur (5,378), Bhagalpur (4,914), Begusarai (4,891) and East Champaran (4,548) are the other majorly affected districts in the state.
Even as cases rise in Bihar, its low positivity rate and mortality rate suggest that the state has fared better than most in its fight against the global pandemic.


Comments
0 comment